Section 6B: Using scanSTAT to Detect Artifacts
Sad but true: artifacts are notoriously common in MRI data. The overall goal of scanSTAT is to prevent wasted MRI and subject time, by ensuring that you have a complete data set before sending your subjects home. To this end, automated artifact detection is a key feature. The approach to artifact detection was outlined in Section 6. Here you can demsontrate some of these functions.
- Start scanSTAT and select File->Open Time Data… then navigate to the file 'Sample data:MGH types:Artifacts' , where you will find the file, 'SpikeArtifacts.bshort' This is a single slices from a particularly bad day of imaging (we reseated the analog to digital convertor boards and fixed the problem...).
- Select File->Define Paradigm...->Use File and load the paradigm file, 's7.p'. Note that this file does not define any behavior. Instead, it weights all images equally.
- Make sure that you have checked 'Check for Artifacts' in 'Statistics->Statistical Options...'

- Now run File->Start Calculation... . As the images are processed you will see that colored marks appear on the time course that is shown below the images. These indicate that scanSTAT has labeled these individual images as likely to contain artifacts.

- Select Display->Show Artifact Data Graph. You will now see the time course of the features studied by scanSTAT to indicate artifact conditions.
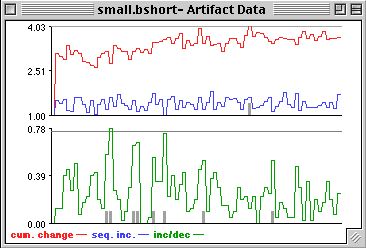
- Note the dark gray vertical lines on the upper graph. These indicate probable spike artifacts (more than 25% of the pixels have been classified as changing from below, to above, noise threshold. You will likely want to visually confirm this condition.
- Move the cursor over to the Artifact data graph and click on any of these lines. The corresponding image will be displayed (note the number 3 in the upper left). Shown below is the image associated with the first (left-most) 'artifact'. The diagonal banding is a pretty definitive indicator of an electrical spike discharge. Feel free to look at the other features that scanSTAT has uncovered. To explore this option further, lower the detection thresholds for the other artifact types, and observe how the artifact detection feature behaves.
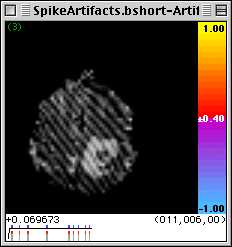
What is that number in the lower left?
While processing the data, scanSTAT is also calculating the correlation between the behavioral paradigm and the detected image motion, the coefficient of correlation is shown just below the images during and after calculation. As of this writing, we have not carefully validated these numbers, so you should take them with a grain of salt. Nevertheless, if the correlation is high, you might consider that the correlated pixels relate to motion that is synchronous with the task. A future revision of scanSTAT will show you the locations of pixels whose 'activation' is best explained by motion. Note also that at the moment scanSTAT looks only at in-plane motion, though through-plane motion will be included in later releases.
Go back to previous section
Go to next section
Go back to main page