Many parameters of the statistical calculation, as well as the display, can be varied, included image smoothing, color maps, overlay thresholds, global normalization, etc... This interactivity makes scanSTAT a very useful tool in exploring the data.
The next section of the walkthrough illustrates alteration of options which affect the data before the statistical tests are applied.
Tutorial/Demonstration - Altering Prospective Statistical Parameters
This section of the walkthrough begins exactly where the previous one left off. If you have made any changes since running the previous section, or if you are beginning at this section, follow the instructions in the previous section to bring yourself to the correct point in the analysis.
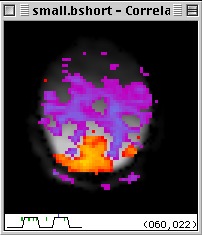
The calculation is performed as in the previous section of the walkthrough, with the new conditions provided by the changes made just above. Note that the statistical overlay is much more rounded, reflecting the Hanning filter smoothing which we applied.
The statistical overlay after Hanning smoothing and global normalization