Contents
function MRPhysics()
Contrast Properties
In many cases, it is possible to approximate the signal intensities of various body tissues for any given pulse sequence, if properties of the tissue are known.
The crucial tissue properties are: Proton density (usually close to 1) T1, T2, T2* - (T2* is not exactly a tissue property...)
All three relaxation parameters have a field strength dependence. T2* depends also on the location of the tissue within the magnetic field.
Here we will use the known signal intensity equations for a few common imaging sequences and tissues to examine contrast behavior
Starting with tissues
We use a struct definition for convenience. A tissue is defined as
 Tissue.t1
 Tissue.t2
 Tissue.pd
 Tissue.t2star
Here are nominal values at 3 Tesla
We assume that the magnet is shimmed to within 0.25 ppm giving
T2prime = 150;    % msec
R2prime = 1/T2prime;

Grey.t1 = 1500;  % msec
Grey.t2 = 75;
Grey.pd = 0.95;
GreyR2 = 1/Grey.t2;
% The observed relaxation rate depends on both T2 and T2prime:
Grey.t2star = 1/(GreyR2 + R2prime)

White.t1 = 1400;
White.t2 = 65;
White.pd = 0.95;
WhiteR2 = 1/White.t2;
White.t2star = 1/(WhiteR2 + R2prime)

CSF.t1 = 3000;
CSF.t2 = 180;
CSF.pd = 1;
CSFR2 = 1/CSF.t2;
CSF.t2star = 1/(CSFR2 + R2prime)
Grey =

        t1: 1500
        t2: 75
        pd: 0.9500
    t2star: 50


White =

        t1: 1400
        t2: 65
        pd: 0.9500
    t2star: 45.3488


CSF =

        t1: 3000
        t2: 180
        pd: 1
    t2star: 81.8182
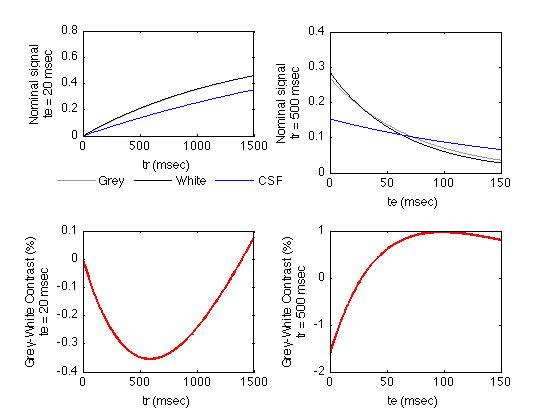
Signal intensity and contrast vs. sequence parameters in a spin echo sequence
We can make plot of the signals as functions of sequence parameters. It is useful to have a set of starting parameters
tr = 500;
te = 20;

trmax = tr * 3;
trmin = 0;
trstep = (trmax-trmin)/499;    % Plot 500 points

temax = 150;
temin = 0;
temax = max(te*3, temax); % we plot long te values in all cases.
testep = (temax-temin)/499;    % Plot 500 points

% The SpinEcho function is defined in SpinEcho.m
GreySE_TR = SpinEcho( Grey, trmin:trstep:trmax, te );   % Signal for a range of tr's
GreySE_TE = SpinEcho( Grey, tr, temin:testep:temax );   % Signal for a range of te's
GreyColor = [0.6 0.6 0.6];  % grey

WhiteSE_TR = SpinEcho( White, trmin:trstep:trmax, te );
WhiteSE_TE = SpinEcho( White, tr, temin:testep:temax );
WhiteColor = [0 0 0];   % black

CSFSE_TR = SpinEcho( CSF, trmin:trstep:trmax, te );
CSFSE_TE = SpinEcho( CSF, tr, temin:testep:temax );
CSFColor = [0 0 1]; % blue


% Plot the tissue signals vs. tr
figure;
subplot(2,2,1);
plot( trmin:trstep:trmax, GreySE_TR, 'Color', GreyColor);
set(gcf,'Color','White');
hold;
plot( trmin:trstep:trmax, WhiteSE_TR, 'Color', WhiteColor);
plot( trmin:trstep:trmax, CSFSE_TR, 'Color', CSFColor);
set(gca,'xlim',[trmin trmax]);
xlabel( 'tr (msec)' );
YAxisLabel = sprintf('Nominal signal\nte = %d msec',te);
ylabel(YAxisLabel);
legend1 = legend('Grey','White','CSF');
legend(legend1,'boxoff');
set(legend1,'Location','SouthOutside','Orientation','Horizontal');

% Plot the grey-white contrast
subplot(2,2,3);
plot( trmin:trstep:trmax, 100 * (GreySE_TR - WhiteSE_TR), 'linewidth', 2, 'Color', 'red');
set(gca,'xlim',[trmin trmax]);
xlabel( 'tr (msec)' );
YAxisLabel = sprintf('Grey-White Contrast (%%)\nte = %d msec',te);
ylabel(YAxisLabel);

% Plot the tissue signals vs. te
subplot(2,2,2);
plot( temin:testep:temax, GreySE_TE, 'Color', GreyColor);
hold;
plot( temin:testep:temax, WhiteSE_TE, 'Color', WhiteColor);
plot( temin:testep:temax, CSFSE_TE, 'Color', CSFColor);
set(gca,'xlim',[temin temax]);
xlabel( 'te (msec)' );
YAxisLabel = sprintf('Nominal signal\ntr = %d msec',tr);
ylabel(YAxisLabel);

% Plot the grey-white contrast
subplot(2,2,4);
plot( temin:testep:temax, 100 * (GreySE_TE - WhiteSE_TE), 'linewidth', 2, 'Color', 'red');
set(gca,'xlim',[temin temax]);
xlabel( 'te (msec)' );
YAxisLabel = sprintf('Grey-White Contrast (%%)\ntr = %d msec',tr);
ylabel(YAxisLabel);
Current plot held
Current plot held
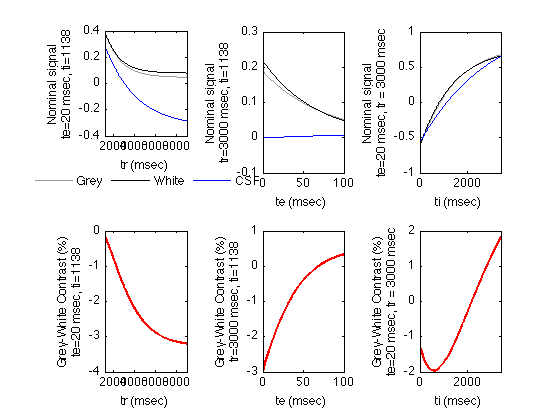
Signal intensities for an Inversion Recovery Sequence.
Plot the tissue signals vs. tr, te and ti The IR function is defined in IR.m
% We start with shorter tr's and te's for IR than for the other
% sequences

tr = 3000;
te = 20;
ti = 1138;
Magnitude = false;   % Magnitude images only (not phase sensitive)

trmax = tr * 3;
trmin = ti;
trstep = (trmax-trmin)/499;    % Plot 500 points

temax = 100;
temin = 0;
temax = max(te*3, temax); % we plot long te values in all cases.
testep = (temax-temin)/499;    % Plot 500 points

timin = 0;
timax = max(tr,3*ti);
tistep = (timax-timin)/499;

GreyIR_TR = IR( Grey, trmin:trstep:trmax, te, ti, Magnitude );
GreyIR_TE = IR( Grey, tr, temin:testep:temax, ti, Magnitude );
GreyIR_ti = IR( Grey, tr, te, timin:tistep:timax, Magnitude );
GreyColor = [0.6 0.6 0.6];  % grey

WhiteIR_TR = IR( White, trmin:trstep:trmax, te, ti, Magnitude );
WhiteIR_TE = IR( White, tr, temin:testep:temax, ti, Magnitude );
WhiteIR_ti = IR( White, tr, te, timin:tistep:timax, Magnitude );
WhiteColor = [0 0 0];   % black

CSFIR_TR = IR( CSF, trmin:trstep:trmax, te, ti, Magnitude );
CSFIR_TE = IR( CSF, tr, temin:testep:temax, ti, Magnitude );
CSFIR_ti = IR( CSF, tr, te, timin:tistep:timax, Magnitude );
CSFColor = [0 0 1]; % blue

% Plot the tissue signals vs. tr
figure;
subplot(2,3,1);
plot( trmin:trstep:trmax, GreyIR_TR, 'Color', GreyColor);
set(gcf,'Color','White')
hold;
plot( trmin:trstep:trmax, WhiteIR_TR, 'Color', WhiteColor);
plot( trmin:trstep:trmax, CSFIR_TR, 'Color', CSFColor);
set(gca,'xlim',[trmin trmax]);
xlabel( 'tr (msec)' );
YAxisLabel = sprintf('Nominal signal\nte=%d msec, ti=%d',te,ti);
ylabel(YAxisLabel);
legend1 = legend('Grey','White','CSF');
legend(legend1,'boxoff');
set(legend1,'Location','SouthOutside','Orientation','Horizontal');

% Plot the grey-white contrast
subplot(2,3,4);
plot( trmin:trstep:trmax, 100 * (GreyIR_TR - WhiteIR_TR), 'linewidth', 2, 'Color', 'red');
set(gca,'xlim',[trmin trmax]);
xlabel( 'tr (msec)' );
YAxisLabel = sprintf('Grey-White Contrast (%%)\nte=%d msec, ti=%d',te,ti);
ylabel(YAxisLabel);

% Plot the tissue signals vs. te
subplot(2,3,2);
plot( temin:testep:temax, GreyIR_TE, 'Color', GreyColor);
hold;
plot( temin:testep:temax, WhiteIR_TE, 'Color', WhiteColor);
plot( temin:testep:temax, CSFIR_TE, 'Color', CSFColor);
set(gca,'xlim',[temin temax]);
xlabel( 'te (msec)' );
YAxisLabel = sprintf('Nominal signal\ntr=%d msec, ti=%d',tr,ti);
ylabel(YAxisLabel);

% Plot the grey-white contrast
subplot(2,3,5);
plot( temin:testep:temax, 100 * (GreyIR_TE - WhiteIR_TE), 'linewidth', 2, 'Color', 'red');
set(gca,'xlim',[temin temax]);
xlabel( 'te (msec)' );
YAxisLabel = sprintf('Grey-White Contrast (%%)\ntr=%d msec, ti=%d',tr,ti);
ylabel(YAxisLabel);

% Plot the tissue signals vs. ti
subplot(2,3,3);
plot( timin:tistep:timax, GreyIR_ti, 'Color', GreyColor);
hold;
plot( timin:tistep:timax, WhiteIR_ti, 'Color', WhiteColor);
plot( timin:tistep:timax, CSFIR_ti, 'Color', CSFColor);
set(gca,'xlim',[timin timax]);
xlabel( 'ti (msec)' );
YAxisLabel = sprintf('Nominal signal\nte=%d msec, tr = %d msec',te,tr);
ylabel(YAxisLabel);

% Plot the grey-white contrast
subplot(2,3,6);
plot( timin:tistep:timax, 100 * (GreyIR_ti - WhiteIR_ti), 'linewidth', 2, 'Color', 'red');
set(gca,'xlim',[timin timax]);
xlabel( 'ti (msec)' );
YAxisLabel = sprintf('Grey-White Contrast (%%)\nte=%d msec, tr = %d msec',te,tr);
ylabel(YAxisLabel);
Current plot held
Current plot held
Current plot held
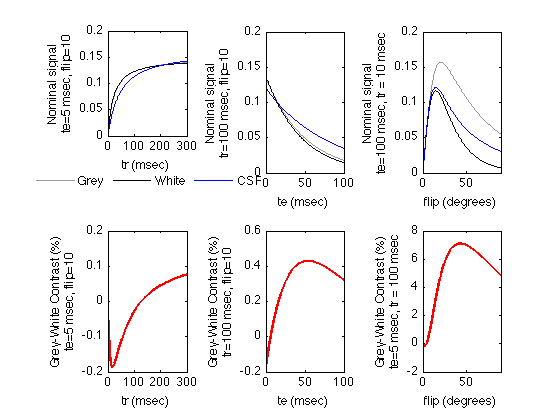
Signal intensities for a FLASH Sequence
Plot the tissue signals vs. tr, te and flip angle The FLASH function is defined in FLASH.m
% We start with shorter tr's and te's for FLASH than for the other
% sequences

tr = 100;
te = 5;
flip = 10;

trmax = tr * 3;
trmin = 0;
trstep = (trmax-trmin)/499;    % Plot 500 points

temax = 100;
temin = 0;
temax = max(te*3, temax); % we plot long te values in all cases.
testep = (temax-temin)/499;    % Plot 500 points

flipmin = 0;
flipmax = 90;   % degrees
flipstep = (flipmax-flipmin)/499;

GreyFL_TR = FLASH( Grey, trmin:trstep:trmax, te, flip );
GreyFL_TE = FLASH( Grey, tr, temin:testep:temax, flip );
GreyFL_flip = FLASH( Grey, tr,te, flipmin:flipstep:flipmax );
GreyColor = [0.6 0.6 0.6];  % grey

WhiteFL_TR = FLASH( White, trmin:trstep:trmax, te, flip );
WhiteFL_TE = FLASH( White, tr, temin:testep:temax, flip );
WhiteFL_flip = FLASH( White, tr, temin:testep:temax, flipmin:flipstep:flipmax );
WhiteColor = [0 0 0];   % black

CSFFL_TR = FLASH( CSF, trmin:trstep:trmax, te, flip );
CSFFL_TE = FLASH( CSF, tr, temin:testep:temax, flip );
CSFFL_flip = FLASH( CSF, tr, te, flipmin:flipstep:flipmax );
CSFColor = [0 0 1]; % blue

% Plot the tissue signals vs. tr
figure;
subplot(2,3,1);
plot( trmin:trstep:trmax, GreyFL_TR, 'Color', GreyColor);
set(gcf,'Color','White')
hold;
plot( trmin:trstep:trmax, WhiteFL_TR, 'Color', WhiteColor);
plot( trmin:trstep:trmax, CSFFL_TR, 'Color', CSFColor);
set(gca,'xlim',[trmin trmax]);
xlabel( 'tr (msec)' );
YAxisLabel = sprintf('Nominal signal\nte=%d msec, flip=%d',te,flip);
ylabel(YAxisLabel);
legend1 = legend('Grey','White','CSF');
legend(legend1,'boxoff');
set(legend1,'Location','SouthOutside','Orientation','Horizontal');

% Plot the grey-white contrast
subplot(2,3,4);
plot( trmin:trstep:trmax, 100 * (GreyFL_TR - WhiteFL_TR), 'linewidth', 2, 'Color', 'red');
set(gca,'xlim',[trmin trmax]);
xlabel( 'tr (msec)' );
YAxisLabel = sprintf('Grey-White Contrast (%%)\nte=%d msec, flip=%d',te,flip);
ylabel(YAxisLabel);

% Plot the tissue signals vs. te
subplot(2,3,2);
plot( temin:testep:temax, GreyFL_TE, 'Color', GreyColor);
hold;
plot( temin:testep:temax, WhiteFL_TE, 'Color', WhiteColor);
plot( temin:testep:temax, CSFFL_TE, 'Color', CSFColor);
set(gca,'xlim',[temin temax]);
xlabel( 'te (msec)' );
YAxisLabel = sprintf('Nominal signal\ntr=%d msec, flip=%d',tr,flip);
ylabel(YAxisLabel);

% Plot the grey-white contrast
subplot(2,3,5);
plot( temin:testep:temax, 100 * (GreyFL_TE - WhiteFL_TE), 'linewidth', 2, 'Color', 'red');
set(gca,'xlim',[temin temax]);
xlabel( 'te (msec)' );
YAxisLabel = sprintf('Grey-White Contrast (%%)\ntr=%d msec, flip=%d',tr,flip);
ylabel(YAxisLabel);

% Plot the tissue signals vs. flip
subplot(2,3,3);
plot( flipmin:flipstep:flipmax, GreyFL_flip, 'Color', GreyColor);
hold;
plot( flipmin:flipstep:flipmax, WhiteFL_flip, 'Color', WhiteColor);
plot( flipmin:flipstep:flipmax, CSFFL_flip, 'Color', CSFColor);
set(gca,'xlim',[flipmin flipmax]);
xlabel( 'flip (degrees)' );
YAxisLabel = sprintf('Nominal signal\nte=%d msec, tr = %d msec',tr,flip);
ylabel(YAxisLabel);

% Plot the grey-white contrast
subplot(2,3,6);
plot( flipmin:flipstep:flipmax, 100 * (GreyFL_flip - WhiteFL_flip), 'linewidth', 2, 'Color', 'red');
set(gca,'xlim',[flipmin flipmax]);
xlabel( 'flip (degrees)' );
YAxisLabel = sprintf('Grey-White Contrast (%%)\nte=%d msec, tr = %d msec',te,tr);
ylabel(YAxisLabel);
Current plot held
Current plot held
Current plot held
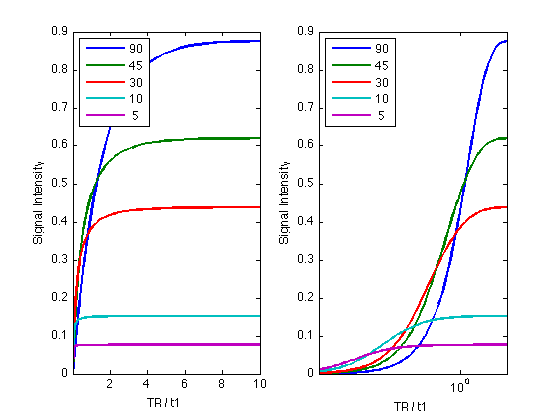
Flip angle, TR, T1
clear;
figure;
T2prime = 150;    % msec
R2prime = 1/T2prime;
Grey.t1 = 1500;  % msec
Grey.t2 = 75;
Grey.pd = 0.95;
GreyR2 = 1/Grey.t2;
% The observed relaxation rate depends on both T2 and T2prime:
Grey.t2star = 1/(GreyR2 + R2prime);

flip = [90,45,30,10,5];
expon = -3:0.05:1;
TR_T1 = 10.^expon;
te = 4;

for angle = 1:5
    MySignal(angle,:) = FLASH( Grey, TR_T1*1000, te, flip(angle) );
end

for p = 1:2
    subplot(1,2,p);
    plot(TR_T1,MySignal(1,:), 'linewidth',2);
    set(gcf, 'color','white');
    hold all;
    for s = 2:length(flip)
        plot(TR_T1,MySignal(s,:), 'linewidth',2);
    end
    legend( num2str(flip(:)),'Location','NorthWest' );
    xlabel('TR / t1');
    ylabel('Signal Intensity');
    set(gca,'xlim',[min(TR_T1), max(TR_T1)]);
end

set(gca,'xscale','log');